Saturday, January 31, 2015

Fieldwork comes to a close

January 26, 2015

The WISSARD fieldwork ends and the last wave of scientists leave camp, myself among them.  It has been a very successful season, and all of us have samples and data with which to work when we get back to our home institutions.  I will have about a week in McMurdo Station before heading back home, stopping in New Zealand for a few  days for some recreation.  Thanks for following me during my journey!

Our camp as seen from the runway: Sleep tents in yellow, galley in long yellow tent, borehole by crane on far right
My sleep tent on the left
Waiting for the go ahead to walk out to the plane and board

Geothermal heat

January 9-19, 2015

Jack Greenberg, marine technician, with geothermal probe
We want to find out how much geothermal heat is being produced in the large rift system which stretches West Antarctica.  The measurement we take here is close enough to the grounding zone to be indicative of the heat flow there, where the ice is in contact with the sediments.  It is important to figure out how much geothermal heat is available to melt the ice sheet from the base.

The geothermal probe we use was built to the specifications of Andy Fisher, a professor at UCSC on the project.  It has a lance at the base with three very precise temperature sensors and lots of weight at the top to help it penetrate the sediments.  Now that we have the temperature gradient in the mud, I will measure the thermal conductivity of the sediments in the lab using samples we collected.  This is all we need to calculate the geothermal heat flux.  From the temperature gradient we have so far, it looks like the geothermal heat flux will be high!


We were happy to find that all three sensors were measured in the mud.
This will help us get a very accurate measurement of the temperature gradient in the mud.

We collect every bit of sediment we can get!
Jack Greenberg, Slawek Tulaczyk, Sarah Neuhaus and me

From the deep

January 9-19, 2015

Collecting water and sediment samples

Jack Greenberg, marine technician, and the Niskin,
which is used to collect water samples

Bringing the gravity corer over the hole

Winch for lowering instruments into the borehole

Gravity corer emerging after a trip to the seafloor.
UV collar surrounds.

Gravity corer with mud outside and inside

Sarah Neuhaus with a sediment core

The sediment is muddy, with rocks on the surface.  Some of the rocks in our cores are volcanic, others are sedimentary and were probably formed during the time of the dinosaurs (dinosaur fossils have been found in the Transantarctic Mountains).


Baby borehole

January 16, 2014

Our team gets set up to start lowering the sensors into the hole
The drillers made a smaller hole, about one foot wide, for a suite of sensors that UCSC integrated for longer-term monitoring.  This is similar to the borehole instrumentation my team used last year at four different boreholes on the Whillans Ice Stream.  It took us about 6 hours to unspool the 760 meters worth of cables and lower them into the hole, taping them together as we lowered.  As we got close to the target depth, we started to monitor the temperature in real time to make sure that we got the bottom most sensors into the water cavity.   Over time, the hole creeps closed and the sensors become frozen into the ice.  This is good for us because then they will start to accurately measure ice temperature and pressure and the flexing of the ice shelf with tidal changes in sea level.

A seismometer and our sensor string are solar-powered.
Inside of the box are a nest of extra cable and a datalogger.

First contact with the grounding zone

January 9, 2015

We got our first peek at the grounding zone using an instrument we call the Doctor, which has a lamp at the bottom and a camera trailing behind.  Members of our team lowered the Doctor down the borehole and brought it back up again, gaining a couple hours' worth of footage of the ice walls and of the cavity between the bottom of the ice shelf and the ocean floor.  From these video images we were able to tell that the hole was wide enough for all 750 meters of its length that it would allow our instruments to pass through.  We were hoping to also find out the depth of the ocean cavity, which decreases the closer you get to the grounding zone itself.  Towards the bottom of the borehole, the camera did not get enough light to see exactly where this transition was.  We would have to wait another 4 hours for the conductivity, temperature, and depth (CTD) instrument to bring us that answer.  Once we were close to the seafloor, the reflected light was sufficient for the camera to bring us images of a muddy bottom with rocks of a range of sizes littered on the surface.

The Doctor
Slawek Tulaczyk and other scientists look at the Doctor footage
Jill Mickuki, a microbial ecologist at U Tennessee, ran the CTD instrument down the hole next, when we learned from a contrast in salinity (we had made the borehole by pumping hot freshwater) and temperature (the seawater is around -1.2 degrees Celsius here) that the ocean cavity was 10m thick.  We were thrilled to get so close to the grounding zone and excited to start collecting samples.

My first boomerang and arrival at the field site

This begins a series of retroactive posts describing our fieldwork.  I fully intended to publish these along the way but I got caught up in all the action.  By now, you may have read some of the articles that have been published about our field season.  Here is the inside story:

January 5-8, 2015

Our first scheduled flight was on January 5.  Donning our ECW (Extreme Cold Weather) gear and packing up our personal and issued gear, we headed up to Building 140, which is both the passenger check-in station and the Post Office.  Here they weigh not only your luggage but you as well so they know exactly how much the plane is carrying.  The next day we loaded up into a Delta, the large passenger truck shown below, for a slow ride out to the field.


Boarding the Delta

Inside the Delta
When we arrived to Williams field we had a few hours to wait before the plane was ready to take off.  The airfield consisted of two rows of trailers and some cargo lines and about three LC-130 aircraft on the field.  

Two hours into our flight we flew over our field site but due to poor visibility we were unable to land.  We found out from our friends at camp later that the fog rolled in only 20 minutes before we hovered above them, as they could hear the noise of the plane nearby.  We were away from the station from 8 am to 4 pm, having traveled without reaching our destination.  This is what it is to boomerang.  It is not an uncommon feature of Antarctic travel, but one I would not care to repeat.

At McMurdo, we continued to hold group meetings among the 12 remaining scientists to hear updates from camp and make plans for our time in the field.  We learned that the drillers were ahead of schedule, and that the hole should be open by January 8.  We all hoped we would make it out to the field in time.  We made a detailed plan of  what instrument should be over the borehole and when.   It served as a good guide for us for the first few days of borehole operations, and as time went on it became more and more heavily revised as we learned more about the environment. 

We were scheduled to fly almost every day after January 5, being delayed each time until January 8. The whole science team was thrilled when we arrived at the field site just a few hours before the drillers would finish pulling their hose out of the borehole, opening it up for use.  If we hadn't made it, the team in the field would have been limited to using those instruments which they had the expertise to run.  When I got off the plane around 7 pm, I was so excited to make my way around the site and check out our lab and the borehole that I only remembered to eat dinner at 11pm.
Pulling the hose out of the borehole

Friday, January 2, 2015

The Science Plan

Photo credit: wissard.org
In 2013 we drilled through the Whillans Ice Stream (WIS) into Subglacial Lake Whillans and both instrumented the hole and took sediment and water samples.  Last year we drilled two holes and instrumented them but didn't take samples from the subglacial environment.  This year we will be drilling to the base of the ice stream again to take samples, but at the grounding zone.  The grounding zone is the transition between ice which is thick enough to sit on the ground and the ice shelf, which floats above the sea floor.  The stability of an ice stream can be characterized by the tendency for the grounding zone to retreat inland.  Grounding zone retreat is typically accompanied by loss in ice mass and a contribution to sea level rise.  It is unclear how long the grounding zone of the WIS was at its present position, but there has been little mass loss from the WIS in recent decades.  By studying the ice-ocean interface, we can start to address the questions:
     How stable is the WIS?
     What kind of substrate is the ice grounded?
     How does the sediment coming from upstream influence this substrate?
     At what rate is warmer seawater melting the ice at the grounding zone?
     In what manner is subglacial water discharged into the ocean?

The WISSARD team found life in the subglacial water and sediments of Subglacial Lake Whillans, and we want to know what kinds of life inhabit the grounding zone.  Subglacial water and melting ice provide fresh water and ocean currents bring in salty water.  How saline is this environment?  The weathering of rocks as the ice flows over them provides a source of nutrients to microbes that 
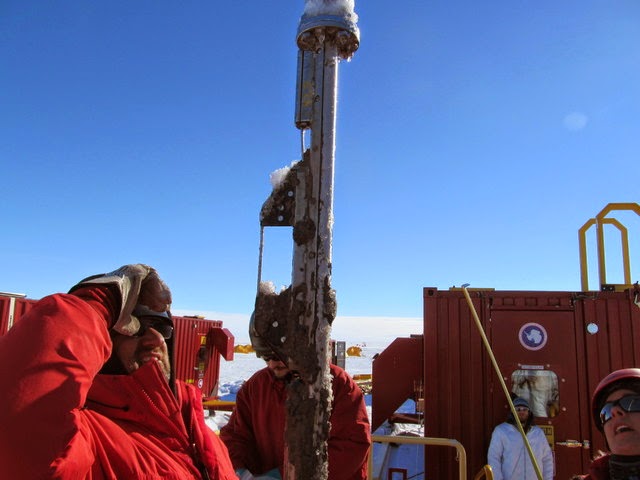
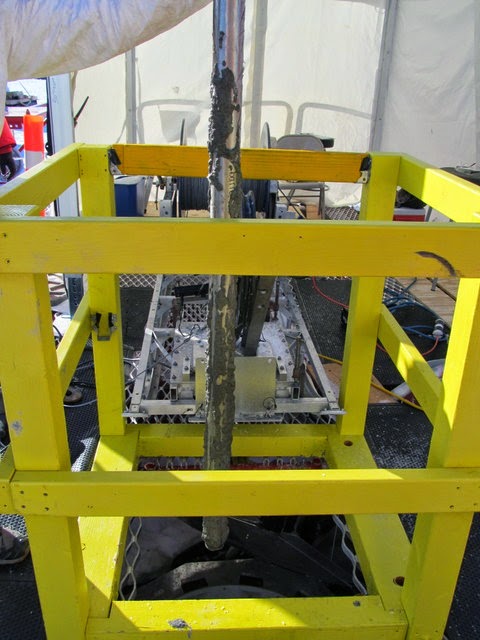
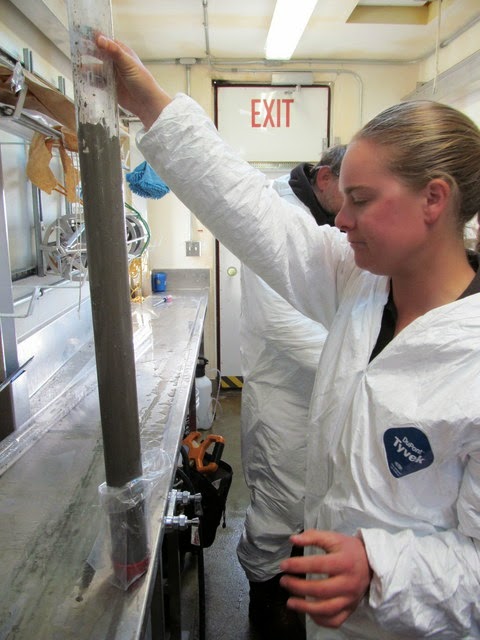
Martyn Tranter will study.  We plan to take samples of the sediment from the seafloor, seawater in the grounding zone, and basal ice.  Ice at the base of the ice sheet tends to have layers of dirty ice that it picked up along the way.  In some places at the base of the ice it is melting and in other places it is freezing.  Often when the subglacial water freezes onto the ice, it does so with pieces of the substrate, rock fragments of whatever size is available.  These basal ice samples thus tell us something about what substrate lies upstream.  This dirty ice eventually flows over sea water and starts to melt at the base, raining out these rocks.  This ice-rafted debris, as the science community calls it, has been identified in sediment cores further out on the ocean floor to reconstruct how the extent of ice has changed through time.  

We know comparatively little about the geology of Antarctica because it is buried beneath the ice sheet.  West Antarctica is home to the largest rift zone in the world and we know there are still active volcanoes in the region.  Geothermal heat flux can provide us important information about the geologic history of the region and give us a better idea of the rate of melting at the base of the ice sheet.  There are few measurements of geothermal heat flux beneath the ice sheet, because it requires drilling to the rocks below the ice.  However, the measurement that we took two years ago at Subglacial Lake Whillans and the measurement from the West Antarctic Ice Sheet Divide, located further east, are much higher than magnetic studies and seismology had predicted.  The UCSC team is excited to get another measurement of geothermal heat flux.  If it is also high, that lends more credence to the hypothesis that the whole region has high heat flow.

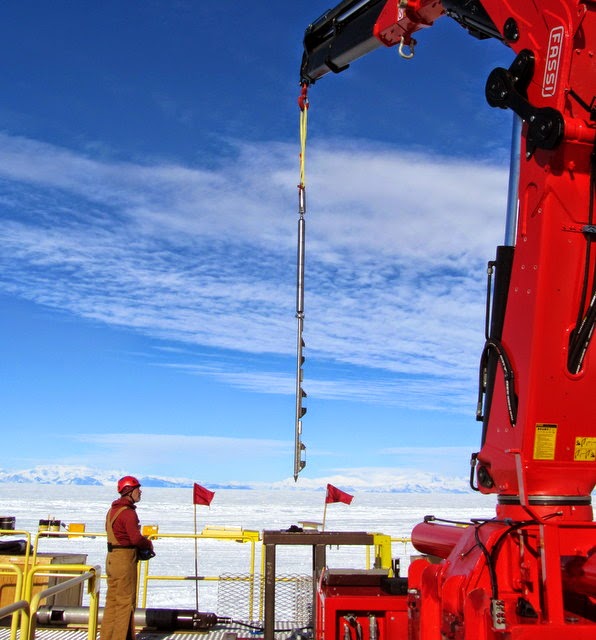
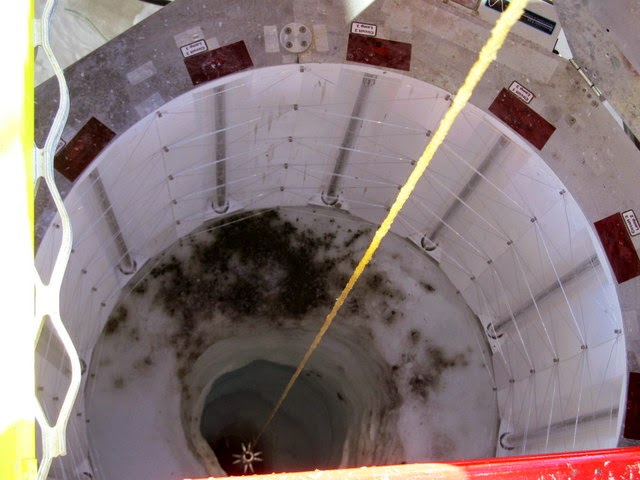
The UCSC team also aims to monitor the ice stream throughout the year.  We have been doing this through passive seismology and GPS at stations scattered over the Whillans Ice Plain.  We have been returning to the last three holes to take measurements Some of these sensors we will be using this year are the same as those in other holes; temperature, pressure, tilt, seismometers; and the turbidity sensor is a new addition.  The more sensors we have, the more cables we need to simultaneously lower down the hole.  The more independent cables we have, the more winches we need to lower them and more hands to operate the winches.  Because of this challenge, we spent some time in Santa Cruz taping two of the cables together so they could go off of the spool at once.  As we lower all the cables down the hole, we'll also be taping them together so they will all hang together and we'll know exactly what the spacing is between them.
This turbidity sensor looks at the amount of light that is reflected to determine how murky the water is.  We want to know how the amount of sediment being discharged from the subglacial environment changes through time.


We received news today that the visibility is only 30 feet at the grounding zone due to blowing snow. To minimize drifting we store our cargo in lines parallel to the wind direction.   If the bad weather continues, I may not get into the field with the rest of the team tomorrow.  The drillers plan to carry on, working around the clock in two 12 hour shifts. We hope to have the borehole open in time to fit 8 days of sampling and deploying our instruments.  All of this planning for only 8 days!  We hope everything goes smoothly, but more likely than not there will be some kinks.